
Reporting Tool vs Excel: When It's Time to Upgrade (and What to Look For in 2026)
Manual Excel reporting costs your team $10k+/analyst/year. Learn when to upgrade, what to look for, and how to pick the right reporting tool in 2026.


Manual Excel reporting costs your team $10k+/analyst/year. Learn when to upgrade, what to look for, and how to pick the right reporting tool in 2026.

Customer churn is costing your business more than you think. This guide covers every metric you need, churn rate, churned MRR, payment method signals, contract cohorts, with step-by-step Excel formulas and a real dataset. Plus, see how Glow Reports generates the same analysis automatically.
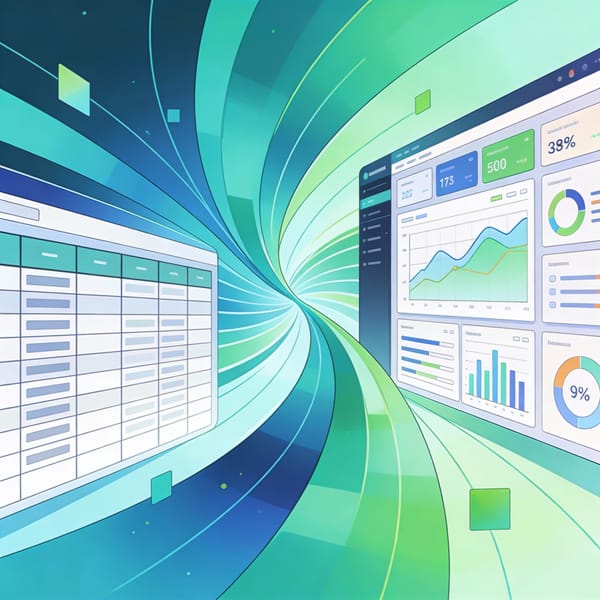
75% of enterprises report Excel limitations in enterprise scalability. For teams struggling to transform data into polished PDF reports and share them reliably, the problem isn't just inefficiency, it's that Excel was never designed for this job.

We're excited to unveil Glow Reports v1; a complete reimagining of how everyone, technical and non-technical alike, can work with data.

Uploading your CSV to ChatGPT seems revolutionary until you hit reality: your data becomes training material, millions of rows get truncated, and automation becomes impossible. Discover why LLMs fail at enterprise data work, and how Glow Reports delivers unlimited processing and automated insights.

One company raised $20 M on Kickstarter—three times. While 85% of projects cluster in the US, Germany’s 83 M consumers account for < 1% of campaigns. Our $109 M data analysis reveals the hidden patterns separating viral successes from failures.
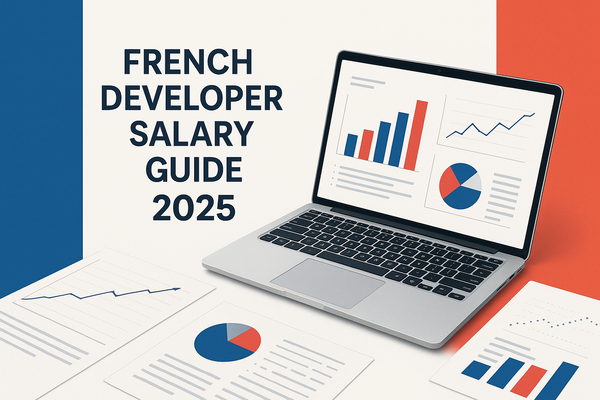
The French tech landscape has never been more dynamic, with over 500,000 tech jobs available and a projected market value of €70 billion by 2025. This comprehensive analysis reveals the current state of developer salaries in France...